Project Overview
Research facilities run instruments continuously,. hydrogen, methane, carbon monoxide and oxygen detectors, ovens, dosimeters, each producing a reading that means nothing on its own.
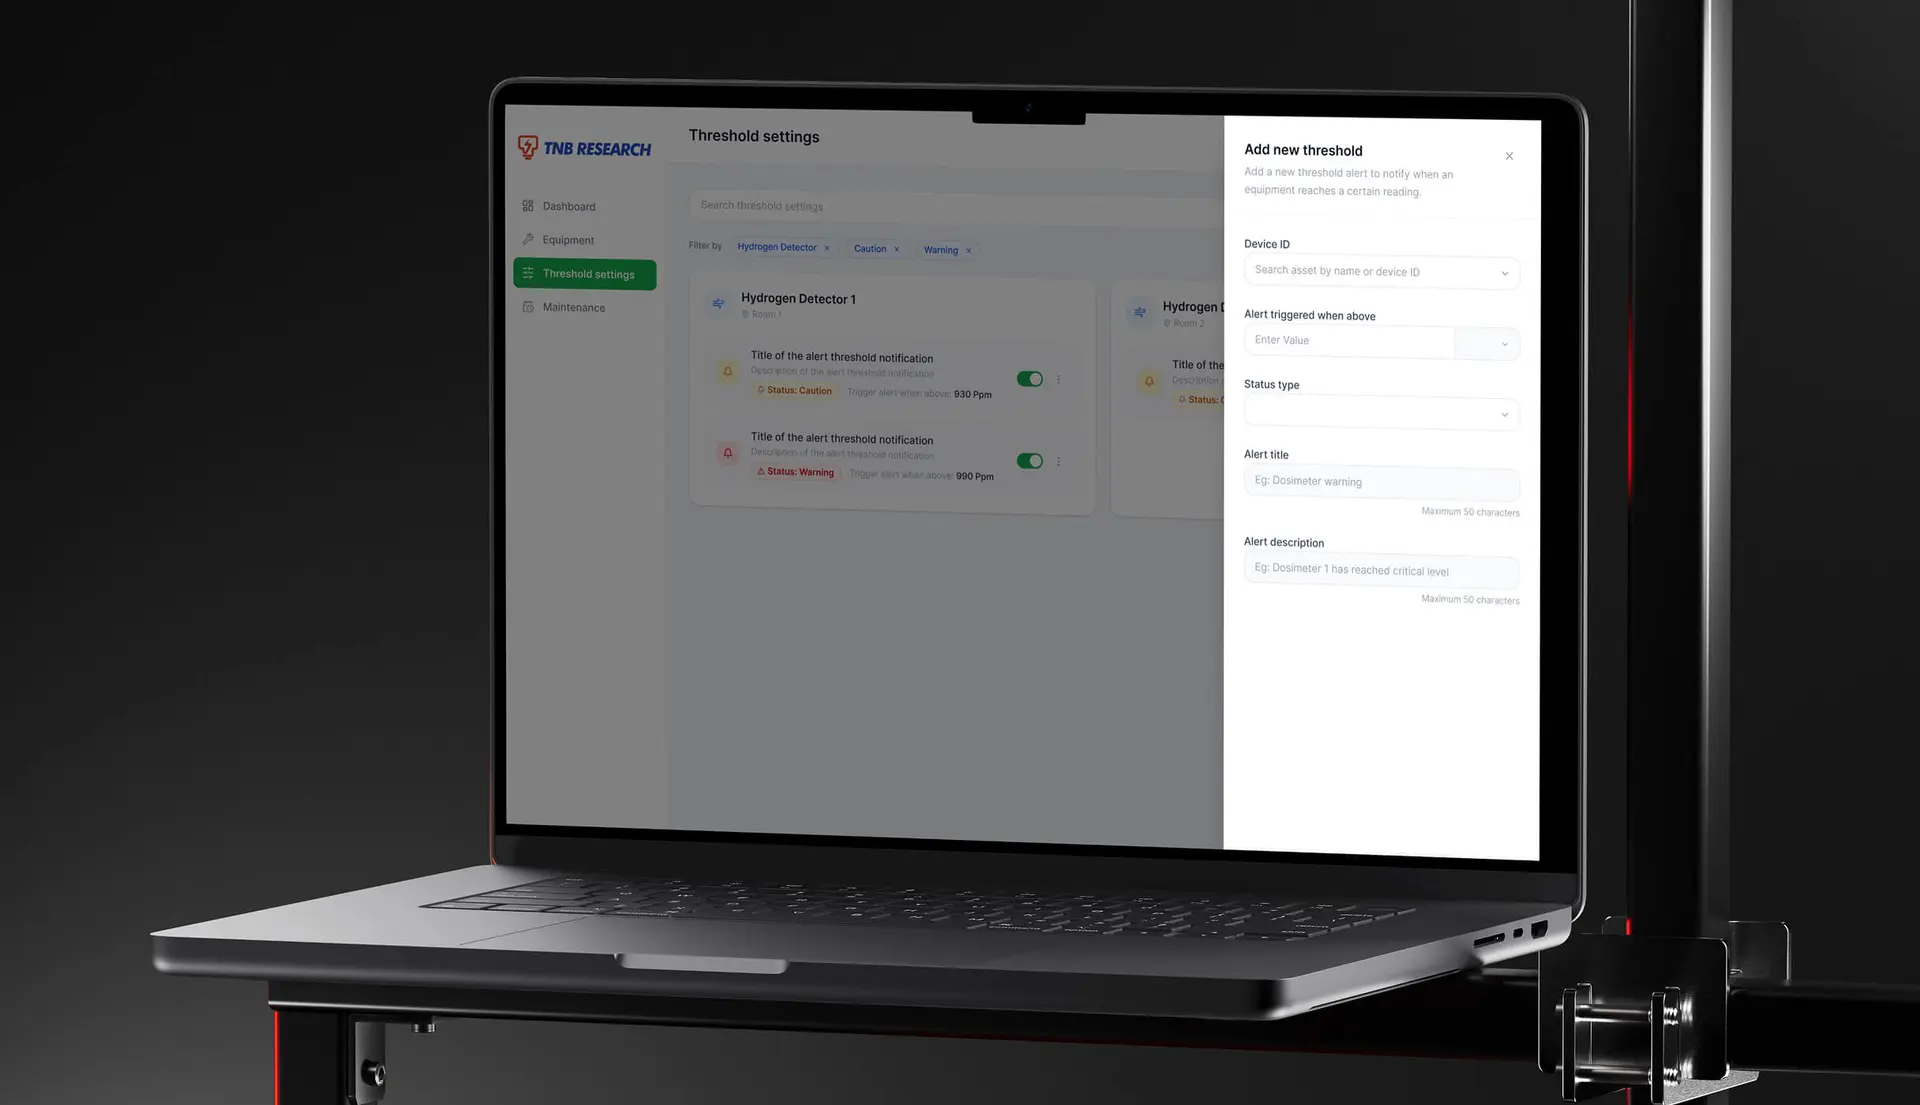
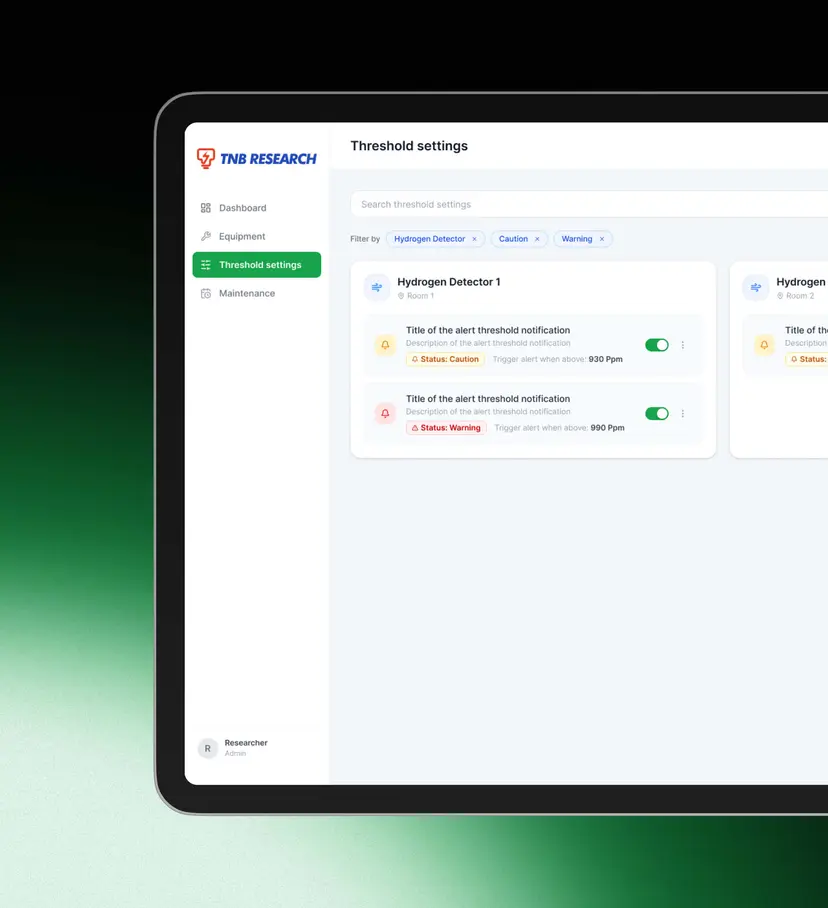
What matters is the threshold: the point at which a normal number becomes a caution, and a caution becomes a warning.Those thresholds differ by room, by instrument and by programme, and they lived in the heads of the people who set them. Readings were logged. The judgement that made them actionable was not.
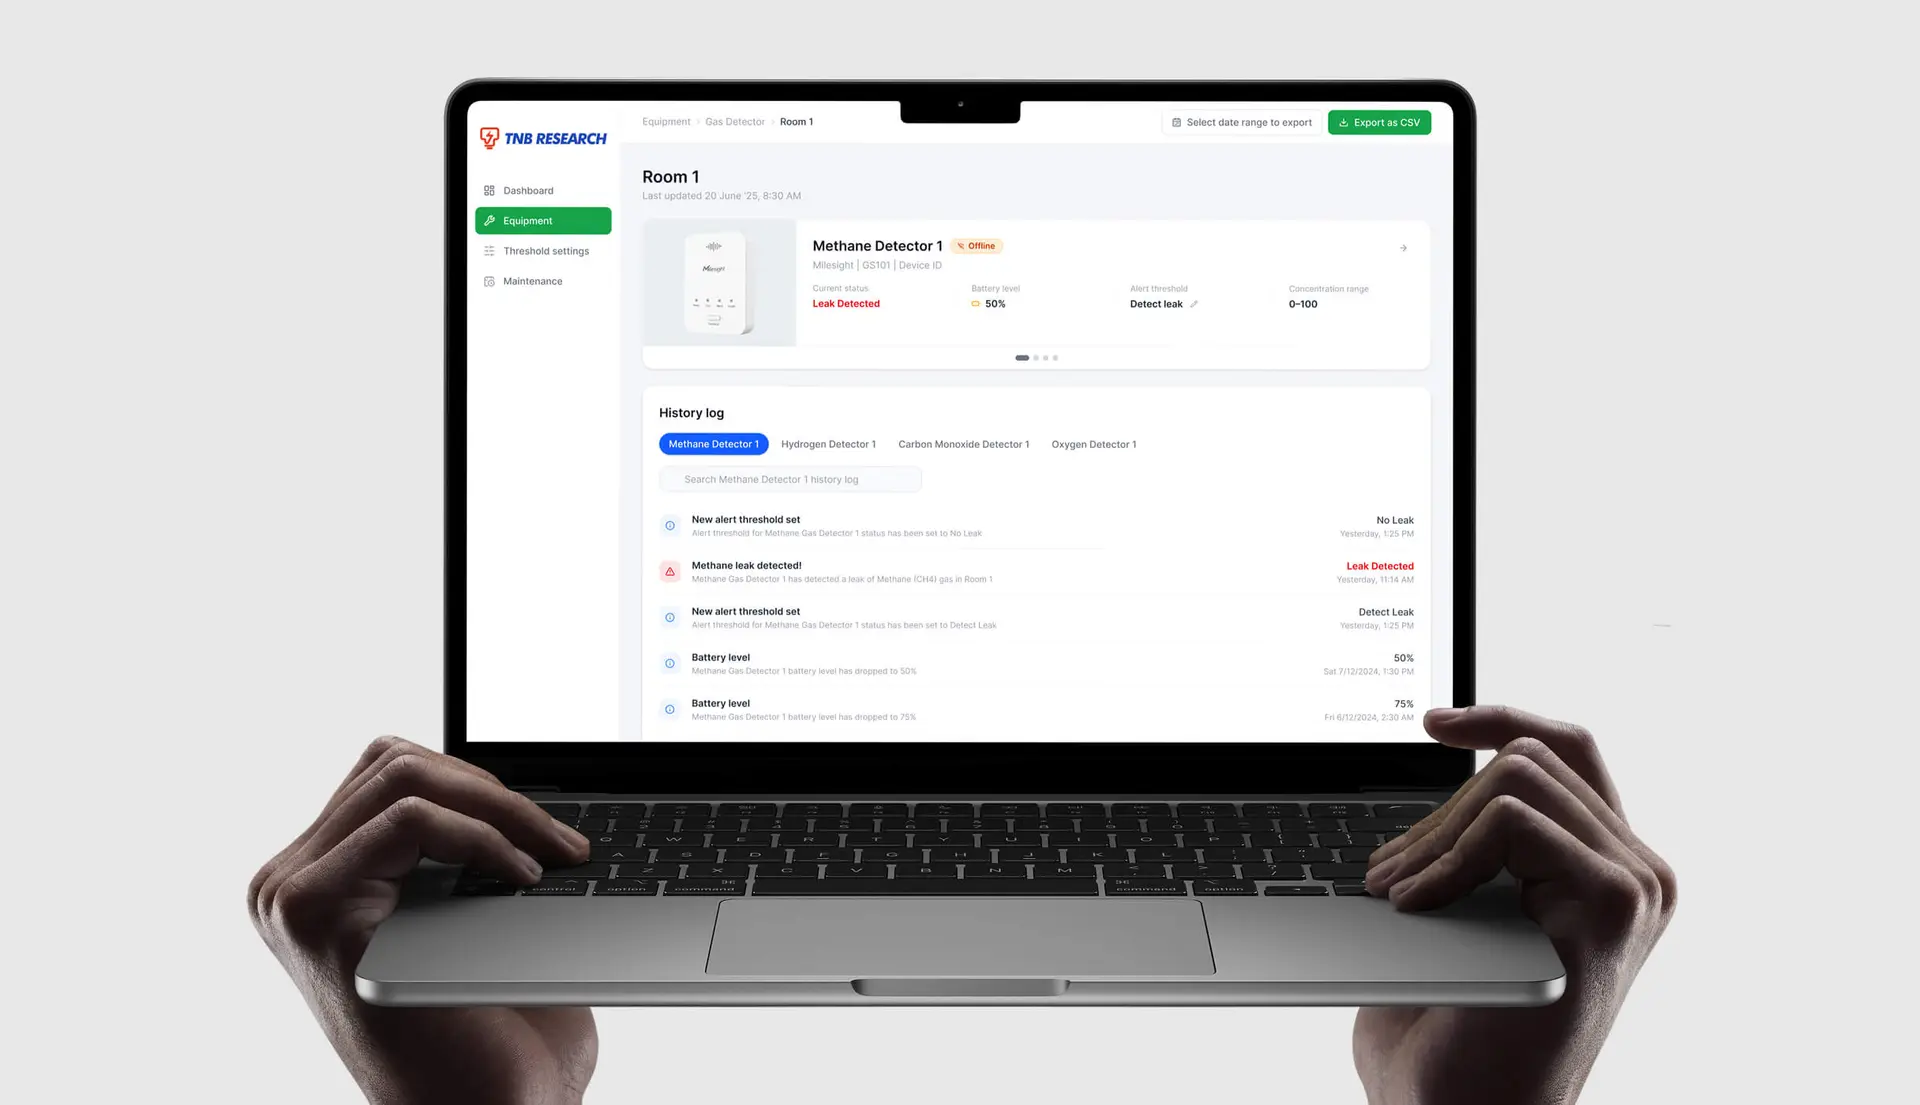
So we were tasked with designing and building a solution for the TNB Labs team to track and monitor these equipment digitally via their dashboard.
My Contributions
I led the UX/UI design for TNB’s eTODS Data Logger, focusing on turning complex operational data into something the Labs team could easily understand and act on.
The challenge was that different equipment produced different types of readings, measurements and thresholds, each with its own requirements and context.I worked through the different workflows to understand how the equipment was monitored and how the data needed to be interpreted, then translated those requirements into clear user flows, information architecture and interfaces.
From wireframes and interaction design to high-fidelity UI and prototypes, I focused on making data-heavy tasks easier to navigate while keeping the information accurate and easy to scan.
I worked closely with TNB stakeholders and developers throughout the process to validate requirements, refine workflows and make sure the designs were practical within the technical constraints.
The result was a more structured way for the Labs team to monitor equipment and make sense of their operational data through a centralised digital dashboard.